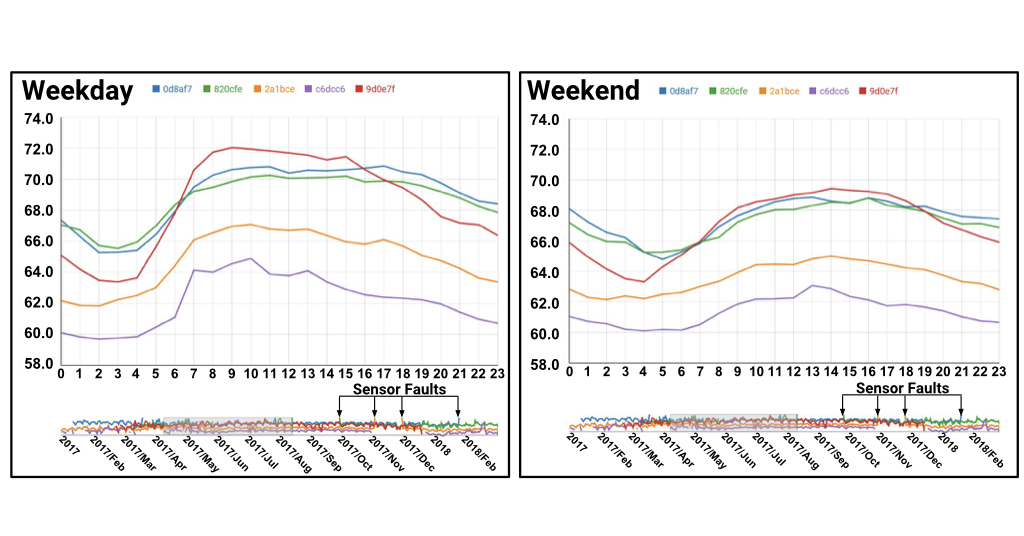
For example, we used the Noise Profiler to rapidly explore and visualize noise patterns in NYC during weekdays versus weekends across multiple locations, using time series data from SONYC noise sensors:
For further details see our paper:
Time Lattice: A Data Structure for the Interactive Visual Analysis of Large Time Series
F. Miranda, M. Lage, H. Doraiswamy, C. Mydlarz, J. Salamon, Y. Lockerman, J. Freire, C. Silva
Computer Graphics Forum (EuroVis '18), 37(3), 2018, 13-22
[Wiley][PDF][BibTeX]

 RSS Feed
